National Debt - What it Means for Our Economy
Narrative of national debt imposing a ‘burden’ on future generations doesn’t stack up when placed in historic context. Borrowing finance to invest in the economy provides benefits for citizens in a similar way as a mortgage taken out by individuals via a bank to purchase a house. Both are large commitments. However, if managed well, can generate future wealth for those involved.
July 2020
What is National Debt?
Before discussing national (public) debt, we need to know what we are dealing with. The Australian Government’s Economic and Fiscal Update July 2020 defined two basic measures of debt that are used throughout this report for consistency1.
“Gross debt measures the face value of Australian Government Securities (AGS) on issue. Net debt equals the sum of interest-bearing liabilities (which includes AGS on issue measured at market value) minus the sum of cash and deposits, advances paid and investments, loans and placements.”
To put these definitions another way, the Parliament of Australia stated the following on gross and net debt2:
“Gross debt indicates the magnitude of debt owed, but it does not show whether a government can repay that debt and provides limited detail about the overall financial health of a government. This is where net debt is significant. If a government has a gross debt of 50 per cent of GDP, but has large amounts of cash and/or assets (low net debt), then it is in a much better position to handle this level of debt.”
Caution does need to be had when comparing countries with similar levels of gross debt as they may have substantially different levels of assets – affecting their net debt. Government debt as a proportion (%) of GDP is used as a comparative tool to determine a countries capacity to service future payments on its debt. This is because GDP activity is tied to tax receipts for the government that are used to service interest payments and debt principal. However, households (you and I) draw more meaning from debt per capita (debt per person) as interest payments on this debt are serviced through taxes.
Ultimately, every dollar of government spending or investment into an economy is a new dollar ‘born’ or introduced into the economy and thus growing it. Every dollar of taxation removes cash out of the economy for re-distribution from one purpose to another. Money used to pay sovereign debt (debt held outside of Australia) or imports represent a leak of money out of the economy and is lost. Therefore, debt, taxes and budget deficits are not inherently detrimental to an economy if used for productive purposes directly through infrastructure or indirectly to increase consumer confidence as examples.
____________________
1 The Honourable Josh Frydenberg MP & Senator the Honourable Mathias Cormann, ‘Economic and Fiscal Update July 2020’, Commonwealth of Australia.
2 Alicia Hall, ‘The Australian Government’s debt position’, Parliament of Australia.
Australia’s National Debt History
All data on Australia’s national debt is measured in terms of ‘Net Debt’ as defined earlier in this report due to information on national gross debt being unavailable at time of publication for history pre-1983 when ABS began compiling this information.
Federation
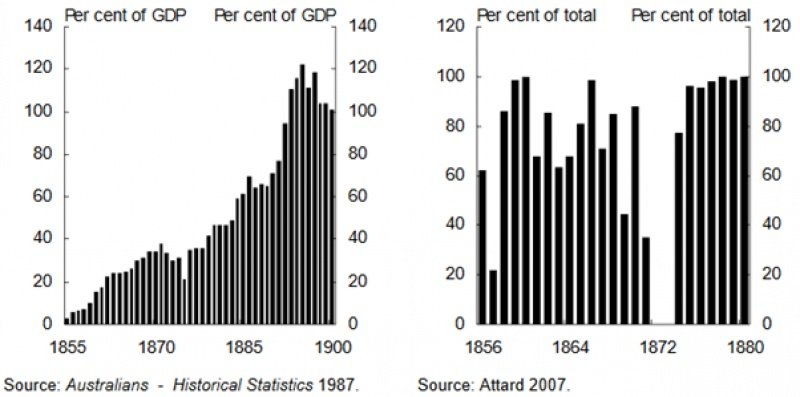
Figure 1 shows colonial-economic development during the period of 1850-1900 where infrastructure was financed by London and gross national debt rose from an estimated 3% of GDP in 1855 to 100% of GDP in 19003.
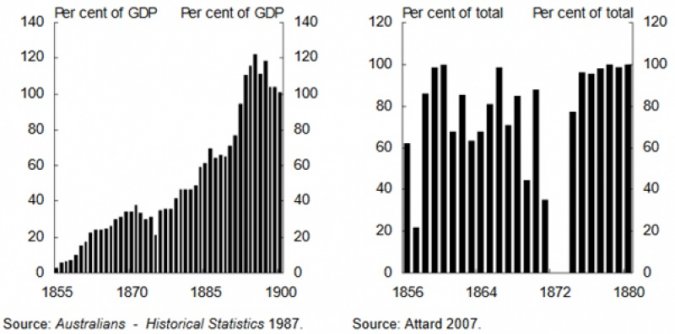
Figure 1 - Federation Australia Debt to GDP
Note. Left chart represents gross debt per cent of GDP, right chart represent debt issued in London as a share of total Australia’s colonial debt issued. Reproduced from “A history of public debt in Australia,” as noted in Footnote 3.
World Wars
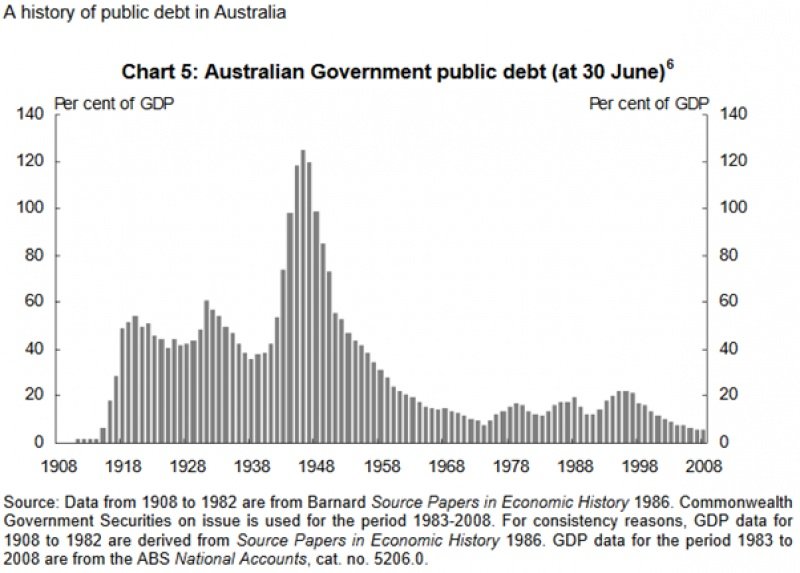
By the end of World War 1, gross Australian Government debt rose from an estimate 2.2% of GDP to 50% of GDP. Approximately one third of this debt was issued by London in the same currency denomination by both countries.3
National debt accrued during World War 2 was mostly financed through domestic borrowing and rose from an estimated 40% of GDP in 1939 to 120% of GDP by 1945.3 This debt was largely eliminated by the 1970s due to a period of economic growth.
Debt Accumulation Between 1970 to GFC
Other periods of Australian national debt accumulation occurred during the 1980s and 1990s due to periods of weakened economic growth and associated budget deficits. However, as shown in Figure 2, the total accumulated debt for both of these periods were small relative to the world wars with a peak of 18.5% debt to GDP in 1995-96. The Australian Government began a suite of asset sales from 1987, mostly through public offerings of equity, of well-known privatisations such as Telstra, Commonwealth Bank of Australia, Airports and Qantas4.
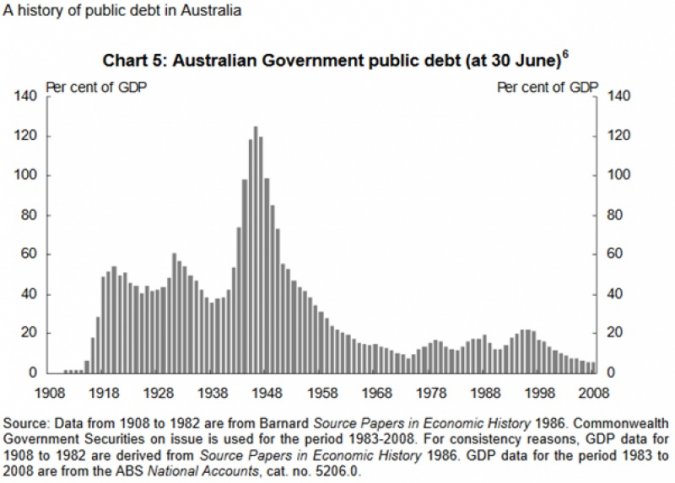
Figure 2 - A History of Public Debt in Australia
Note. Reproduced from “A history of public debt in Australia,” as noted in Footnote 4.
Successive budget surpluses, asset sales and GDP growth led to the elimination of national net debt to GDP by the mid-2000s. Australia experienced historically low net debt to GDP of -3.8% during 2007-08 at the onset of the GFC as shown in Figure 3.
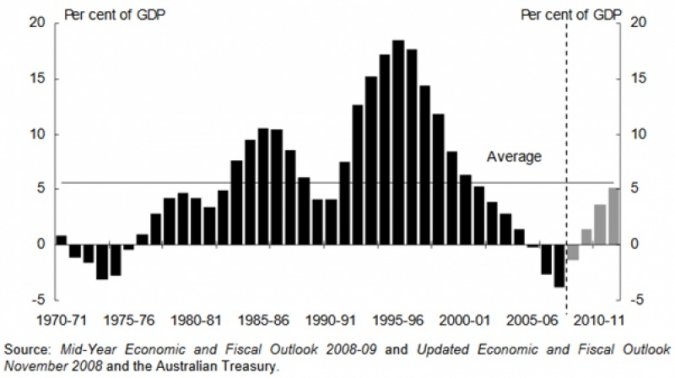
Figure 3 - Australian Government net debt to GDP
Note. Reproduced from “A history of public debt in Australia,” as noted in Footnote 4.
____________________
3 ‘A history of public debt in Australia’, Budget Policy Division, the Australian Treasury, 2019.
4 ‘A history of public debt in Australia’, Budget Policy Division, the Australian Treasury, 2019.
Australian’s Current National Debt
Analysis provided on Australia’s current national debt is represented in terms of ‘Gross Debt’ for comparability with the Commonwealth Government’s Economic and Fiscal Update July 2020 that utilized measures of Gross Debt to GDP. Care must be taken when making comparisons between the following graphs with previous figures as they represent net debt due to the unavailability of gross debt data at time of publication.
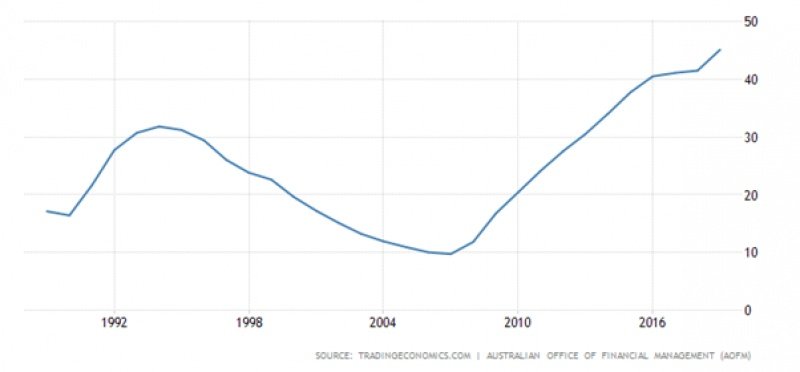
Trading Economics provides data on national debt to GDP for the period of 1989 – 20195. National debt to GDP has been increasing steadily since the GFC as shown in Figure 4 with the following key statistics:
- Highest gross debt to GDP proportion of 45.1% (also current debt level)
- Lowest debt to GDP ratio of 9.7% in 2007
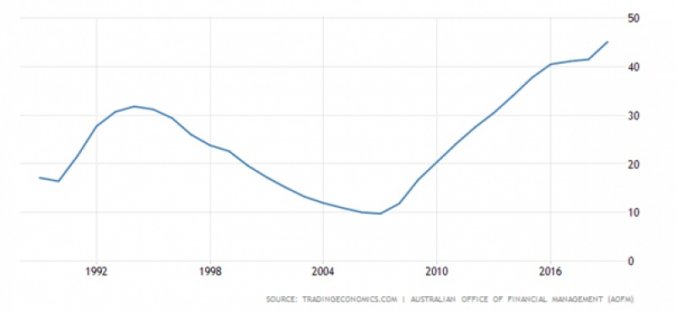
Figure 4 - Australian Government Debt to GDP 1989 – 2019 Data
Note. Reproduced from “Australian Government Debt to GDP” as noted in Footnote 5. This graph displays national gross debt to GDP. Figure 3 represented net debt to GDP, hence the discrepancy is the debt proportions over time. Further explanation of increased national debt due to the pandemic is explained later.
____________________
5 Trading Economics, ‘Australian Government Debt to GDP’, https://tradingeconomics.com/australia/government-debt-to-gdp
Economic Downturn/ Recessions
Australia is experiencing a downturn in economic activity due to the pandemic in line with most global economies. If left unchecked, many analysts expect the most severe global economic scenario from this pandemic to be the worst since the Great Depression. Australian Treasury forecasts real GDP to fall by .25% for FY 2019-20 and by 2.5% in FY 2020-216. As GDP (national production) fell, tax receipts (government revenue) also fell along with an increased need to accrue additional debt as government payments (expenses) are not reduced. However, history states that reductions in expenditure (austerity) reduces the public sector participation in the economy. This reduces GDP and can lead to a recession and is counterproductive during the downturn.
The pandemic has changed conventional thought on the limited role of government in managing economic fluctuations from a greater focus placed on the RBA’s monetary policy to how government expenditure (fiscal policy) is used to reduce shocks to private sector incomes in effort to limit longer-term damage to the economy. RBA Governor Philip Lowe addressed the Anika Foundation on 21 July 2020 with a speech titled ‘COVID-19, the Labour Market and Public Sector Balance Sheets’ to discuss the impact of the pandemic on Australia’s labour market and the role of public sector balance sheets in softening the economic downturn7. Dr Lowe explains that economic downturns cause the following general economic scars:
- Young people not getting onto the jobs ladder, or slipping off it, with permanent effects on their lives.
- People losing training opportunities with long-term consequences for their career prospects.
- Lower levels of investment in physical capital and research.
- The damage to the fabric of our society and to people's lives that is caused by a long spell of unemployment.
These factors cause long-term damage to a country through a deterioration to the structure of the economy that people participate in and inevitably society as a whole. Economic downturns can spill over into financial markets as business and consumer confidence falls. This causes increases to the cost of finance, raising risk that deters investment and reduces available jobs. Therefore, the importance of smoothing out and mitigating economic downturns and recessions are necessary to support the all-important confidence required for the recovery of any economy.
____________________
6 The Honourable Josh Frydenberg MP & Senator the Honourable Mathias Cormann, ‘Economic and Fiscal Update July 2020’, Commonwealth of Australia.
7 Dr Phillip Lowe, ‘COVID-19, the Labour Market and Public Sector Balance Sheets’, https://www.rba.gov.au/speeches/2020/sp-gov-2020-07-21.html#fn3
COVID-19 Pandemic Stimulus
The Australian Government has broadly supported the economy through transfer payments to smooth the impact of the pandemic. From March 2020, the Australian Government has announced economic support of fiscal and balance sheet measures estimated to a value of $289 billion or 14.6% of 2019-20 GDP8. Simply put, these represent direct transfers to households (JobSeeker), to business (JobKeeper) and indirect support through spending on infrastructure and public health.
The Current Cost of Government Borrowing
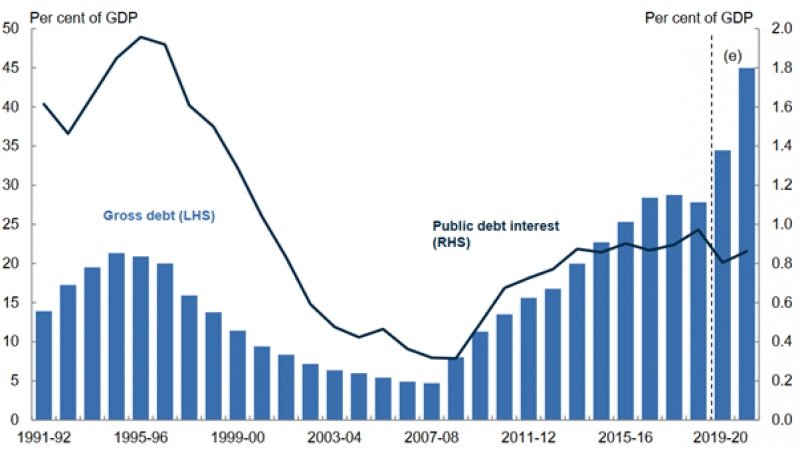
According to the Australian Government, Australian Office of Financial Management, national gross debt was $573.1 billion as of 6 March 2020 – or roughly when the 100th COVID-19 case was recorded in Australia9. As of 30 June 2020, total net debt was $610.9 billion; up from $509 billion at 30 June 2019. At current interest rates, the Australian Government Treasury estimates the current gross debt to GDP ratio of 45% will cost approximately 0.8% of GDP to service, as shown in Figure 510.
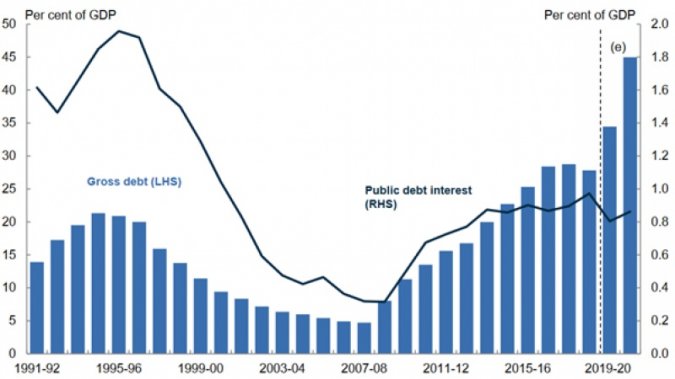
Figure 5 - Gross Debt and Interest Costs
Note. Reproduced from the Australian Government – Treasury “Economic and Fiscal Update July 2020 Chart Pack.”
Australian Government Budget Deficit
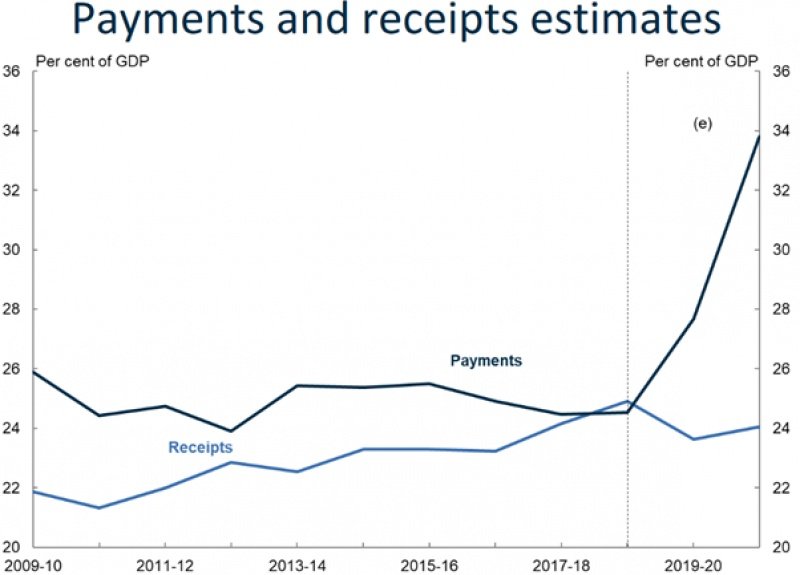
As shown in Figure 6, Government tax receipts (income) have steadily grown since the GFC from 22% to 24% of GDP as of FY 2019/2011. Government payments (expense) has consistently been higher than receipts, except for a brief period in the FY 2017-18. This has caused a rolling budget deficit that has required financing through national debt accumulation. Payments as a percent of GDP has increased substantially due to the pandemic, rising to almost 34% of GDP. The Treasurer announced estimated budget deficits of $85.8 billion for the FY 2019-20 and $184.5 billion for the FY 2020-21 due to their response to the pandemic and associated recession. This level of payments is expected to be temporary. However, the accumulated debt will remain until paid off.
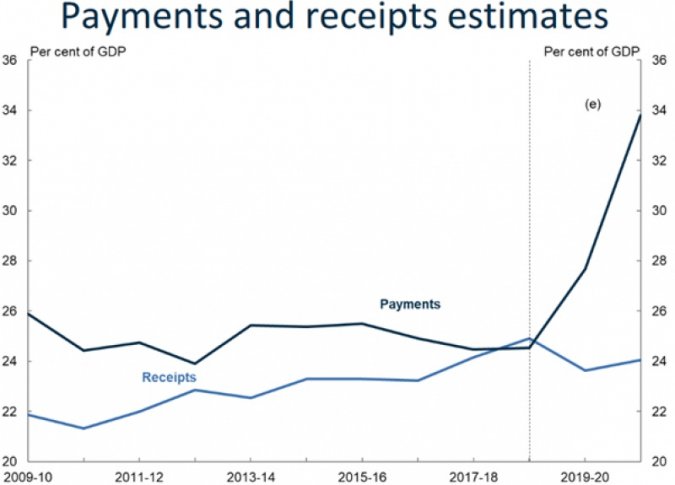
Figure 6 - Australian Government Payments and Receipts Estimates
Note. Reproduced from the Australian Government – Treasury “Economic and Fiscal Update July 2020 Chart Pack.”
____________________
8 The Honourable Josh Frydenberg MP & Senator the Honourable Mathias Cormann, ‘Economic and Fiscal Update July 2020’, Commonwealth of Australia.
9 ‘Data Hub’, Australian Government – Australian Office of Financial Management, https://www.aofm.gov.au/data-hub
10 ‘Economic and Fiscal Update July 2020’, Australian Government, https://budget.gov.au/2020-efu/economic-fiscal-update.htm
11 ‘Economic and Fiscal Update July 2020’, Australian Government, https://budget.gov.au/2020-efu/economic-fiscal-update.htm
12 Dr Phillip Lowe, ‘COVID-19, the Labour Market and Public Sector Balance Sheets’, https://www.rba.gov.au/speeches/2020/sp-gov-2020-07-21.html#fn3
Methods of Reducing National Debt
National debt is accumulated to smooth out economic fluctuations, mitigate economic downturns (recessions) and fund larger expenditure such as that experienced during the World Wars and federation development. National debt ‘inherited’ to the post-war generation saw rapidly-rising living standards and posed negligible barriers to economic growth. As GDP grew, the proportion of debt fell to a level easily managed and inevitably paid off as tax revenue increased not due to higher taxes but through larger volume of taxable transactions.
Other methods of reducing national debt exist. Fiscal policy that generates a budget surplus over time to pay back debt is one. However, this is risky if too much public expenditure is withdrawn from the economy causing reductions in GDP growth or changes to government policy reduces tax receipts (revenue) from lower demand.
Interest Rate manipulation and/ or raising inflation can reduce the proportion of debt relative to GDP. However, a low interest rate and inflationary global financial environment makes this difficult to engineer.
Finally, privatisations, increasing population and access new export markets do improve cash positions of government and increase tax receipts. However, these are additionally difficult during a lower-demand environment induced by the pandemic, Australian economic recession and subdued global export markets.
Economic Growth Inhibitors
RBA Governor Dr Lowe stated that the Government must restore people’s confidence about their:
- Health and the public health response. Without this, people will be reluctant to resume their normal activities and business will be reluctant to hire and invest.
- Finance and job prospects – people want to feel their wealth increase over time and to hold a meaningful job.
- Businesses being confident about future demand – hindered by consumer uncertainty, fragmented markets, and busted supply chains12.
In response to lower demand for many goods and services through government health orders and changes to consumer behaviour, business alter their labour force. This has caused sharp decreases in employment which can lead to problems such as:
- ‘Brain drain’ as skilled workers are severed from their employment and then seek jobs elsewhere.
- Difficulty in filling roles again quickly as it was difficult to fill labour shortages pre-pandemic.
- Generate further uncertainty of future expectations for both workers and businesses.
Many businesses have identified and moved into new opportunities during this pandemic with technology, altering their business model and adjust their supply chain as they have become disrupted. However, excessive uncertainty about future demand still lingers. Households see this directly in terms of jobs. We all know someone that has had their job impacted or lost it completely since March.
RDANI also worry about the potential of a reduction in the value of grants available from Federal and State Governments to Councils and communities for the foreseeable future. These grants fund social programs, community events and much needed infrastructure for regional areas where private sector is not established for the recovery period and export markets are dampened. This will hinder economic recovery for regional Australia.
Recovering from the Pandemic
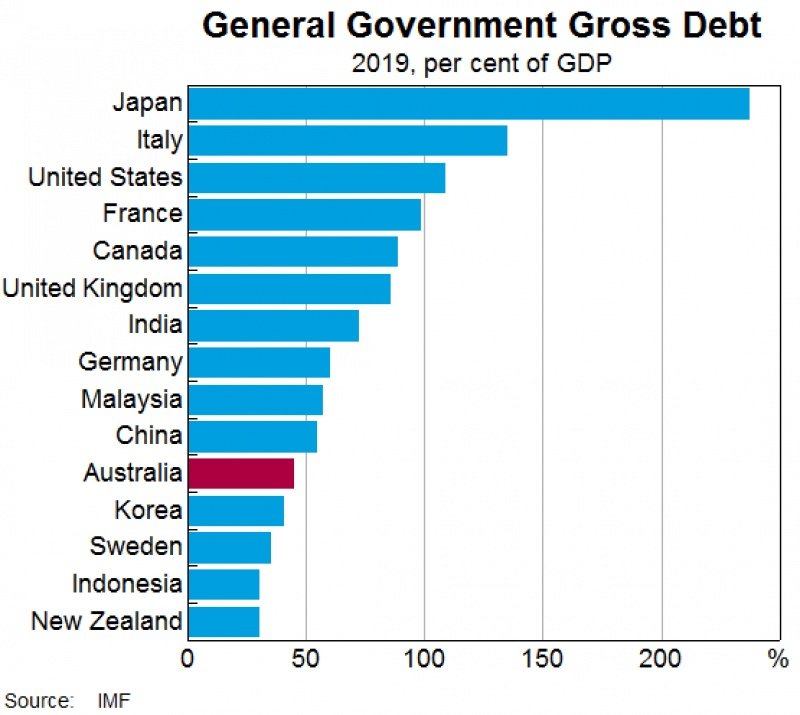
The nominal size of the national debt accrued is not as major a problem for Australia when compared to other countries. Figure 7 demonstrates where Australia is positioned relative to comparable economies. The scary reality faced by Australians are the health concerns caused by the pandemic and the economic impacts due to global and domestic recessions. International, domestic and local demand has been supressed, growth is uncertain and debt is expected to increase and weak exports are expected to prevail over the next decade.

Figure 7 - General Government Gross Debt Relative to Other Countries
Note. Replicated from “COVID-19, the Labour Market and Public Sector Balance Sheets”
Australian households and business have limited capacity to weather this storm of uncertainty with Australian private debt to GDP (debt held by non-financial corporations, households and non-profit institutions serving households) is 200% to GDP in 2019, as shown in Figure 8.
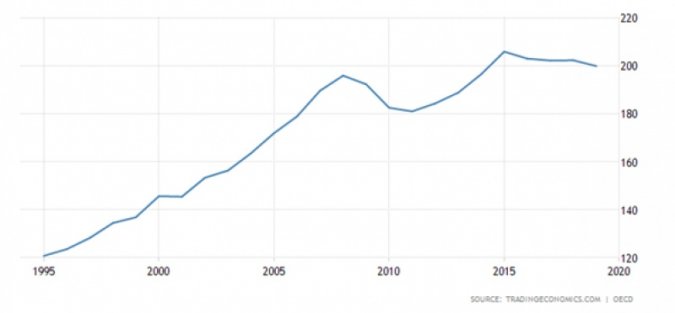
Figure 8 - Private Debt to GDP in Australia
Note. Replicated from “Australia Private Debt to GDP1995-2019 Data.”13
Confidence is key. As Governor Lowe put it, “The fundamental purpose of responding to the pandemic and recession today is to support the all-important confidence of tomorrow.” This means getting people confident about their health and their economic certainty to support the return to normal. Business facing uncertainty about future demand are reluctant to hire and invest. This leads to people being less confident about their own finances and jobs and the more uncertain people are, the harder it is to recover.
Monetary Policy. The RBA are supporting the economy through the pandemic with a country-wide focus to deal with both current and future challenges through policy aimed14:
- To make sure the financial system has plenty of liquidity
- To address dislocations in the government bond markets
- To provide low-cost funding to the banking system, so that lenders can support the provision of credit to their customers
- To reduce funding costs across the whole economy by having a target of around 25 basis points for three-year Australian Government bond yields.
____________________
13 Trading Economics, ‘Australia Private Debt to GDP1995-2019 Data’, https://tradingeconomics.com/australia/private-debt-to-gdp
14 Dr Phillip Lowe, ‘COVID-19, the Labour Market and Public Sector Balance Sheets’, https://www.rba.gov.au/speeches/2020/sp-gov-2020-07-21.html#fn3
Regional Approach to the Recovery
A quote from the Australian Council of Trade Unions president Michele O’Niel “A World War II-sized deficit requires a World War II response to get people into meaningful, secure jobs.” There are many approaches to economic recovery with responses from individual business dependent on their size and industry sector they participate in.
Internationally – By containing the pandemic, Australia is well positioned to fill voids in global markets caused by disrupted supply chains from countries struggling to contain the virus. Those countries that can’t produce due to lockdown restrictions and outbreaks will require to import goods and services - so long as Australia saves-off a second infection wave of this pandemic whilst other countries brace.
Regional economies are traditionally dominated by commodity-based, export-focused industries. These businesses are well-positioned to supply into disrupted global markets if they are provided with the appropriate information and access support from government departments and industry bodies.
Domestically – fragmented domestic supply chains can be repaired quickly - locally. During the peak of the pandemic, Australian breweries repurposed their operation to produce hand sanitiser and medical equipment manufacturers repurposed their operation to produce ventilators and face masks. This was only possible by the Federal Government PPE procurement initiative when information was made available on what was in demand and by who.
Locally - Reducing imports are a viable option through buy local campaigns but also consider a supply local approach. Supply chains have been disrupted by this pandemic. Options to fix supply sources or change the business model include:
- Government-led support to identifying global economic opportunities.
- Look how Australian businesses can supply each other where appropriate.
- Look at neighbouring LGAs, regions and states for new market opportunities.
- Support your neighbour – they may have what you need or new business partnerships could be formed in this rearranging economy.
Working together is the only way through this as we are all most likely doing it tough.
REMPLAN Analysis
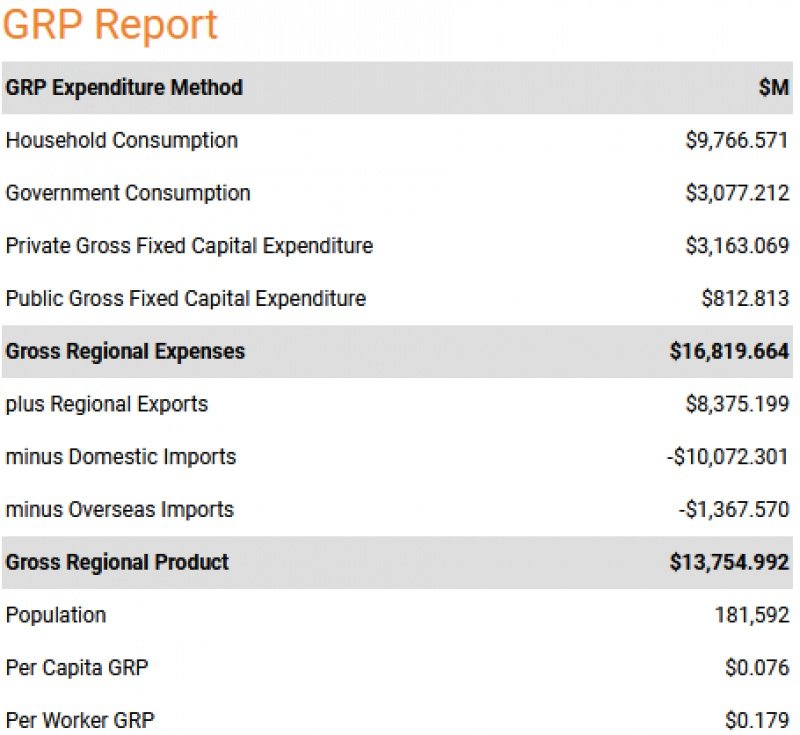
REMPLAN Economic Gross Regional Product (GRP), as shown in Figure 9, demonstrates the current condition of the Northern Inland economy. GRP is the total value of final goods and services produced in the region over the period of one year. The sum of GRP for every region throughout equates to the Gross Domestic Product (GDP) that is referenced throughout this report and what National Debt is measured against. GRP for the Northern Inland was calculated using the Expenditure method. As can be seen from the table, this includes exports but subtracts imports. GRP can be measured by adding up all forms of final expenditure:
- Consumption by households
- Consumption by governments
- Additions or increases to assets (minus disposals)
- Exports (minus imports)
Note. Reproduced from REMPLAN software.
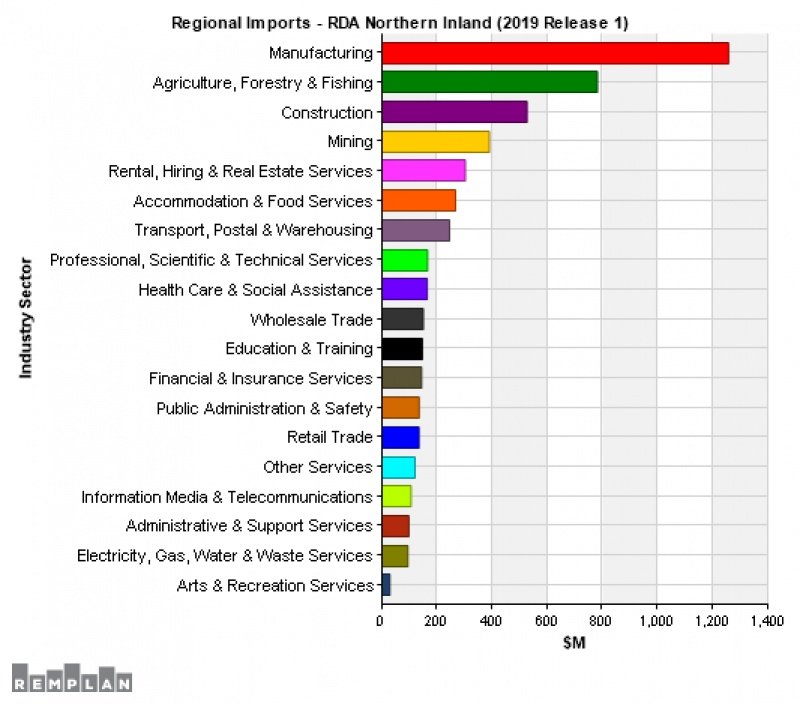
Overseas imports may be difficult to substitute with Australian made goods and services but is nonetheless worth a discussion. Domestic imports are economic leakages outside of the Northern Inland to the value of $10 billion. Not every LGA can become self-sufficient. However, business coordinated throughout regions generate scale and viability for business to be created and import substitution to occur.
Figure 10 demonstrates the value of intermediate goods and services which are imported into Northern Inland per industry sector16. Regional Imports data represents the value ($) of goods and services imported into the defined region by businesses / organisations in each of the industry sectors. Another way of defining imports is as an outflow of money from the region, i.e. A local business outsourcing accountancy services to a firm in another region which results in an outflow of money thus they are importing services. No distinction is made between domestic and international imports, and no indication is given as to the type of imports.

Figure 10 - Northern Inland Regional Imports Report
Note. Reproduced from REMPLAN software.
____________________
15 REMPLAN Economic Software Analysis
16 REMPLAN Economic Software Analysis
References
Australian Treasury. (2019). A history of public debt in Australia. https://treasury.gov.au/sites/default/files/2019-03/01_Public_Debt.pdf
Trading Economics. (2020a). Government debt to GDP. https://tradingeconomics.com/australia/government-debt-to-gdp
Trading Economics. (2020b). Australia Private Debt to GDP1995-2019 Data. https://tradingeconomics.com/australia/private-debt-to-gdp
Australian Office of Financial Management. (2020). Data Hub. https://www.aofm.gov.au/data-hub
Parliament of Australia. (unknown). The Australian Government’s debt position. https://www.aph.gov.au/About_Parliament/Parliamentary_Departments/Parliamentary_Library/pubs/BriefingBook45p/DebtPosition
Reserve Bank of Australia. (2020). COVID-19, the Labour Market and Public Sector Balance Sheets. https://www.rba.gov.au/speeches/2020/sp-gov-2020-07-21.html#fn3
Australian Government. (2020). Economic and Fiscal Update July 2020. https://budget.gov.au/2020-efu/economic-fiscal-update.htm


 Funding & Grants
Don't miss out on funding opportunities. Stay informed with our up to date online listings and email notifications.
Read More
Funding & Grants
Don't miss out on funding opportunities. Stay informed with our up to date online listings and email notifications.
Read More
 Skilled Migration
Our services help both applicants and employers, to learn more, develop plans, submit applications, and settle in.
Read More
Skilled Migration
Our services help both applicants and employers, to learn more, develop plans, submit applications, and settle in.
Read More
 Research and Analysis
Good research and analysis makes the case. How can our resources and services help your project or application?
Read More
Research and Analysis
Good research and analysis makes the case. How can our resources and services help your project or application?
Read More
 Information & Data Resources
With resources like REMPLAN, Regional Knowledge Base, and decades of data, discover how we can help your project.
Read More
Information & Data Resources
With resources like REMPLAN, Regional Knowledge Base, and decades of data, discover how we can help your project.
Read More
 Latest News